2 Why learn R?
If you’ve completed an undergraduate psychology degree there’s a good chance that you’ve been taught statistical analysis using SPSS or STATA. These programs are great, and are capable of conducting some amazing analysis, but data in the real world is often a lot messier than the data you saw during your undergraduate degree. I want you to leave this MSc with the skills needed to deal with that messiness, wherever you may end up, and for me R is an excellent place to hone those skills.
Need more convincing? Here are the usual go-to reasons for learning R as a psychology student.
R is open access and therefore free
SPSS and STATA are ludicrously expensive. A personal licence, at my last check, cost a little over $1000 per year. This is fine for a university to cover (for now), but move away from academia to perhaps a charity or a non-governmental organisation and it’s a cost that many are not willing to pay for.
As such, you may find that there are many jobs out there that you are perfectly capable of doing, from a knowledge point of view, but they just don’t have access to the tools you’ve been trained on.
This was the position that I was in after I finished my last post-doc. Doors were closed to me - really interesting doors where I could have done a lot of good - due to my skill base being too narrow to be applicable to them. I don’t want that to be the case for you. By the end of this course you’ll be able to do all the analysis you can already do on the paid software, in this free and accessible language that is quickly becoming a highly desirable skill for a graduate to have.
Data wrangling
Say you want to conduct some longitudinal research. You find participants, you send them surveys each month, you also perhaps visit them in person and take some bio-physiological measurements (blood pressure, BMI etc). All of this data is recorded and saved across multiple different excel files. Some participants drop out or fail to respond for some of the time points. How do you match participants for your final dataset and combine files into a format where you’re able to run your analysis?
This is a problem that we very rarely cover at undergraduate, but it’s a very common and essential part of the research process, especially with health data collected by a third party (i.e. a charity or the NHS). In the days before I learnt R this kind of problem led me to copy and pasting chunks of data in excel, entering data into SPSS by hand, or any number of long laborious processes that were prone to silly mistakes during lapses of concentration or poor work processes.
There has to be an easier way!
Good news, there is, and it’s R!
The skill to cope with the data problem I’ve described above, and many others, is known as data wrangling and it’s a skill that is best deployed with code. By the end of this module, you should be able to have all your raw data for a project together in a folder, open a script you have written, click run and end up with a perfect dataset ready for your analysis every time.
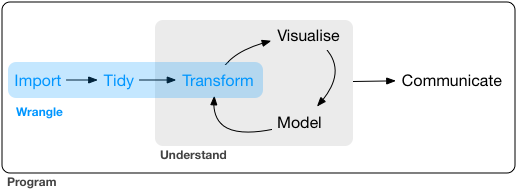
Image from R for data science. It is explained in more detail here
Data visualisations
I never truly understand my data until I can see it. Relationships between variables, differences between groups, location data, all can be visualised quickly and effectively using R. Here are a few of my favourites that I’ve made in R over the years:
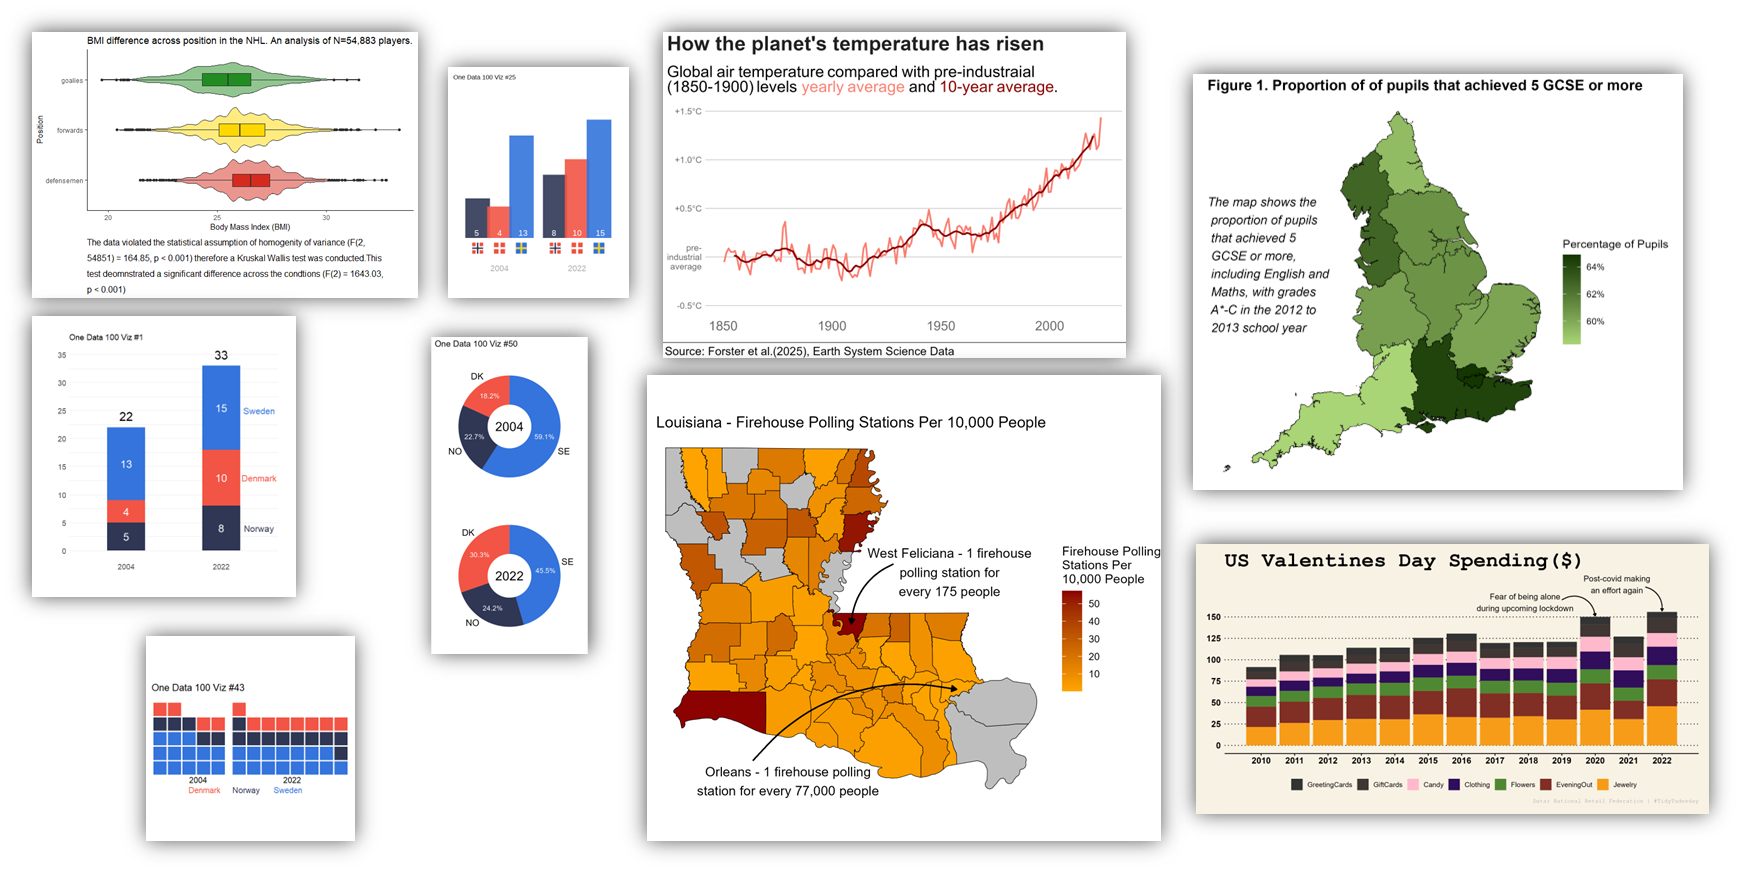
And the great thing about creating these with code is that next time you come across similar data in the same format, you can simply copy your previous code and adapt it to your needs. No more clicking around in excel trying to find the same colours and arrangement from last time, no more ugly SPSS outputs, just publication ready figures that communicate your amazing findings in a way the words just can’t capture.
Reproducibility
If you’ve been in psychology for a while, you may have heard that we are in a “Replication Crisis”. Findings that were previously held up as reliable understandings of the human condition are crumbling into dust once we apply the rigour of the scientific method.
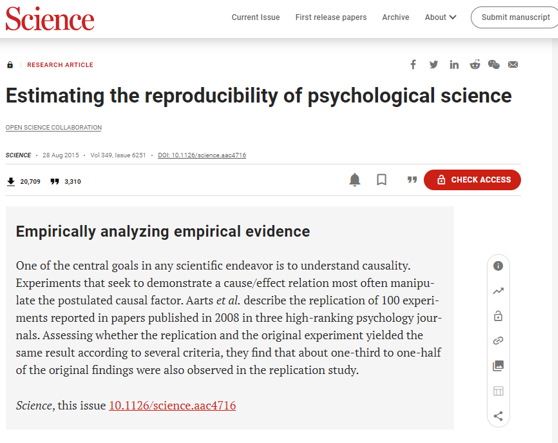
A, now infamous, 2015 study The Open Science Collaboration followed the methodology of 100 experimental reports, from a single year (2008), that had been published in a range of high-ranking journals. The aim was to see how many of the findings replicated (i.e. when repeated, produced the same results). Out of the 100 only 39 were found to successful replicate.
 This finding proved a watershed moment in psychology whereby many of us were starting to question the reliability of our foundational work.
One solution, suggested by the academic community, is to make the process of our science far more transparent. This is were R comes in. The use of R by no means solves all the issues with the replication crisis, but by submitting code along with making our data open access, readers of our work no longer need to “take our word for it” that we’ve conducted an appropriate analysis and correctly reported our results. They can now check for themselves.
Journals are also starting to take note of such a culture shift and are starting to require the submission of analysis scripts. So, with any luck, this skill will start to align more with you getting published in the future.
Hopefully I’ve convinced you of the importance of learning R as a psychology student. If not here is a link to particularly good talk by Phil McAleer from the University of Glasgow on why they moved their undergraduate degree towards a focus on reproducible research, using R for statistics.